Saturday 30 November 2013

Market Update: 30 Nov 2013


We have come to the last month of 2013. Usually December seem to be low volatility month where by people start packing their luggage for holidays especially Index like STI which been floating sideway for so long. However the bull on other indices seems not interested for a holiday trip yet. They have been going higher and higher where by people believe X’mas gift will come before the day itself.
Anyway let’s look back on those indices which I charted out last week and another 2 chart which consist of Gold & AUDNZD. 

Please trade wisely :)

DJI seem like going to approach my highlighted resistance. Watch out for any reverse candlestick

HangSeng have touched 24000. If the next candlestick able to stay above this 24k whole figure resistance. Watch out for the next resistance.

Shanghai in the weekly chart candlestick show a successfully breakout which i have pointed out last week on my blog. Let's see whether it able to go for the next resistance.

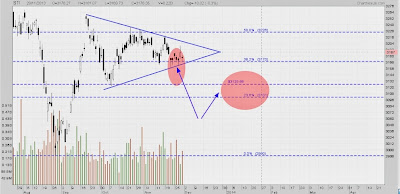
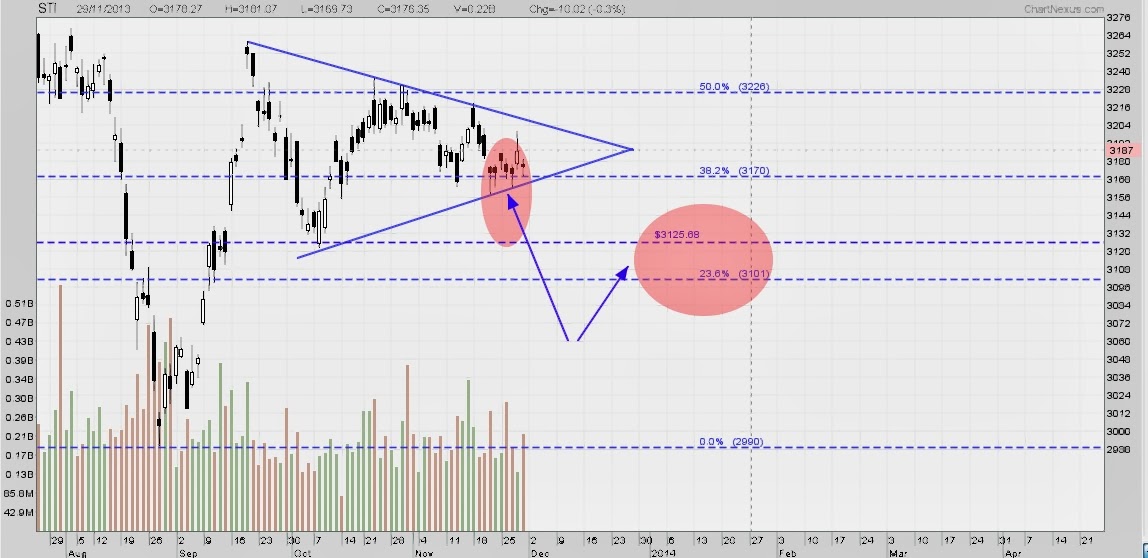
STI remain the least movement for the week. symmetrical triangle still in play. Like I mentioned during last week. Perhaps STI will stuck inbetween the FIBO till end of year.

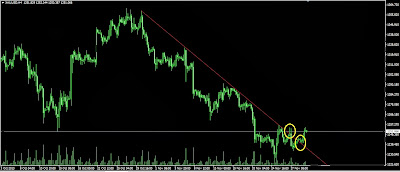
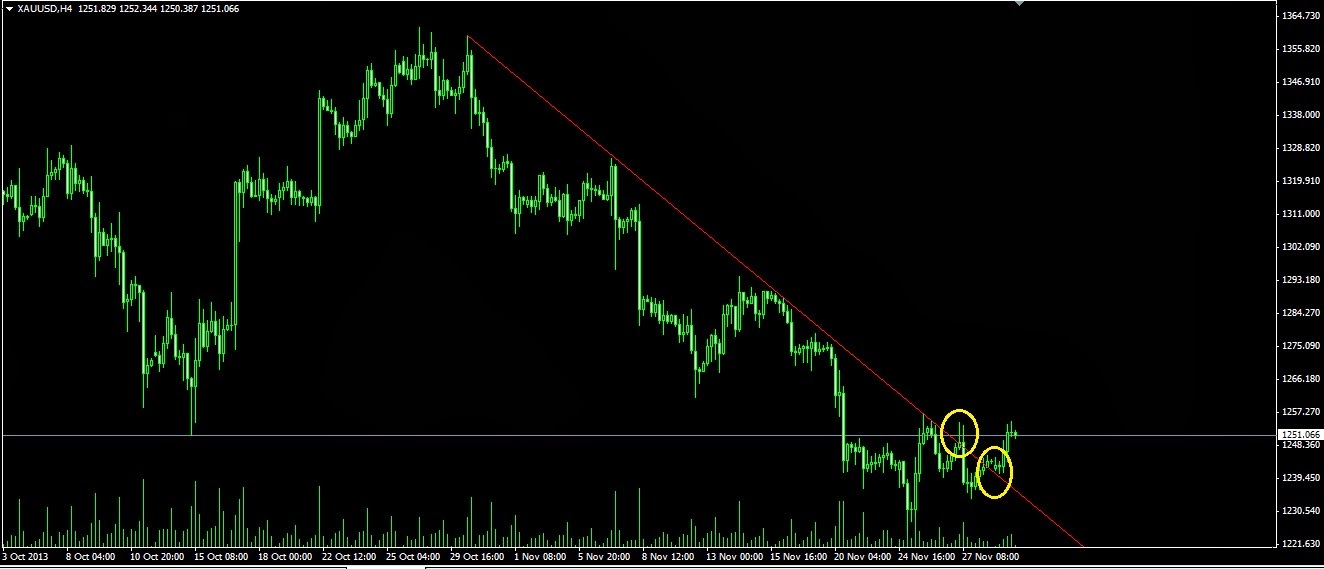
Congrats to those who follow my blog and traded on this breakout in the 4Hour chart. For those who traded on the breakout, my advise will be do a trail stop or step breakeven your stoplost.

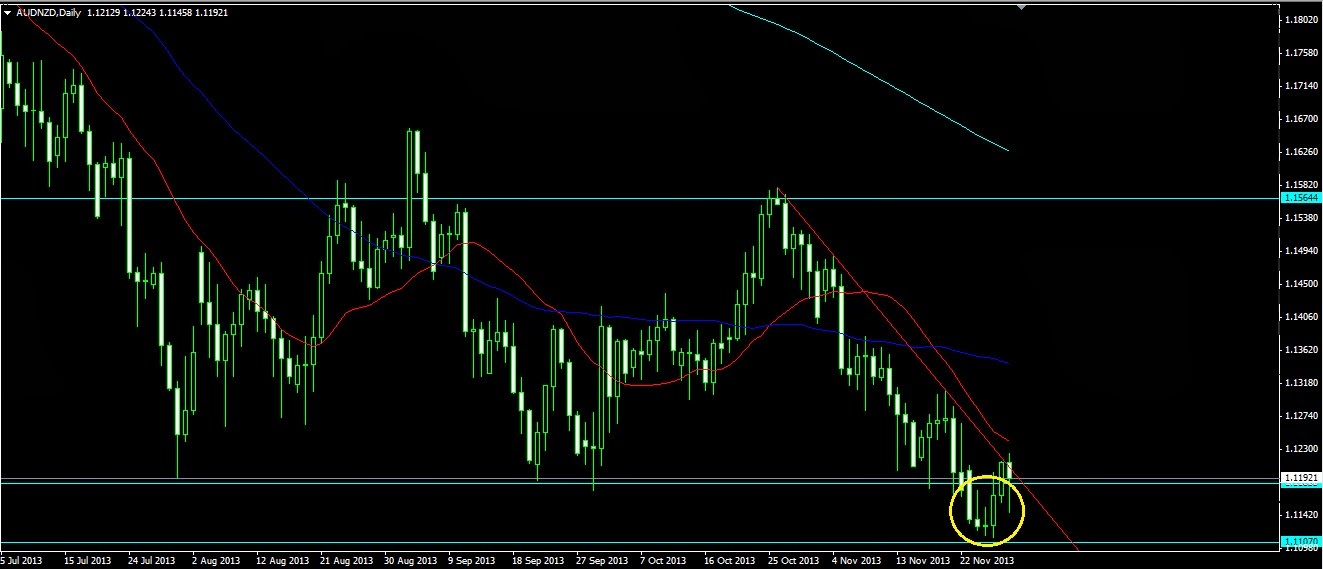
AUDNZD have been in trend playing for weeks. The first circle which break below the support may seem to be a fake breakout. If you are keen in this trade. my advise will be: Entry after it break the trend line which i draw on the chart with a stop lost @ 1.110. RR is good with a 90pips stop lost over 300pips of profit target. (side note, both currency are strong and they are interested to lower the strength of their currency. So wont be one-sided game. Side way trading will seem to be fine)

Thursday 28 November 2013

Stock Chart: Gold

Gold have been in the long term bearish since no tapering on the QE announced on September. Everyone seem to shift their fund into US stock market and causing Gold to become unattractive. However people will start wondering when will gold rebound and gain back his honour in the commodity world. Perhaps when gold really drop all the way to 1000usd/oz or when FED really announce their tapering in the next coming event which fall on next year March 2014.
However base on TA point of view, from the 4hour chart, we can see that gold have a false break out on the first yellow circle but rebound back to go for a second try to break the resistance. If it success to break this resistant, we shall see gold price will head towards 1258 follow by 1278 and a correction on DJI.

All trade is about probability, if you are keen in this breakout, please plan for your own risk.


Entry: 1245
SL: 1230
Target: 1258/1278


Wednesday 27 November 2013

Stock Chart: Wing Tai & Swiber

Wing Tai have been supported by 200d MA.
Buy: Once $203 break with good volume.
Target: $208 once break 214 next
Stop Lost: $1.98/$1.95

Swiber have been trending upward with the support of the trend line.
Long:  $current price,
SL: $0.625/0.612
Target: $0.67/0.69

Tuesday 26 November 2013

Stock Chart: Rotary


Breakout from descending triangle.

Entry: if volume continues to surge and break $0.67

Exit: $0.635

Target: $0.72

RR: 1.428

Stock Chart: Singtel

Singtel show a sign of touching 200d MA which may act as an immediate support @ $3.65.
However the chart is too cloudy to show the next movement. I have indicated 3 different colors of arrow to show the possibility ways it will move around.
My advice; get a plan for this trade with a better Risk Reward Ratio:
1) Buy only if there is any sign of support showing @ $3.65
2) Sell only when break the support of $3.65 (break 200D MA)
3) Sell if resistance successfully to block @ $3.77 and when the first resistances break do a small sell averaging. (Average only when you are in the profit)

Take Note: SingTel (SGX Symbol: Z74) is now trading cum-dividend.