Sunday 12 May 2019

Market Update: 12 May 2019

Ongoing US-China trade war will be the spark for the upcoming week. Last Friday, Thanos (Trump) threat to raise tariffs on $200 billion worth of Chinese exports from 10% to 25%, making a sharp escalation in tension between the world’s two largest economics. The coming days could be crucial waiting for China’s response.

DJI recovered around 300+ points and closed above the channel last Friday. Based on the chart, DJI might climb to around 26300 points or trade within the channel if it break above 26300. I believed Thanos (as a business man) will not destroy this bullish market created by him. However, he may create an artificial bearish as a reason for Fed to reduce interest rate. Nevertheless, DJI chart show a good trade setup to go long. SL once the price closes below the channel.

STI showing no clear signal after it has traded down over the last week from 3400 point. As I mentioned previously, no position consider as a position. Those who bought during the fake breakout highlighted in yellow, are trapped at the moment. I will continue to stay aside from STI till a better trade setup appears.

WTI is trading between 50% & 61.8% Fibo currently. Base on the weekly chart, WTI failed to close above the S/R line at $64. Therefore, I assume WTI will continue to trade sideways between 50% & 61.8% and high chance will reach to 38.2% ($58 follow by $55.70).

Overall: Everyone is waiting for Mr.Bear to hit the market. However, if crisis can be predicted accurately, it will not be name as a crisis. I strongly believed a Chinese comic idiom: “成也风云败也风云” which can be use over here as “成也特朗普败特朗普” (The idiom mean success and failure are both due to the same factor)

You are remind to trade base on your own risk. Plan and Trade well :)

Monday 6 May 2019

Weekday Market Update: 06 May 2019

Trumps' finger snap and the market plunge down on Monday. However, whether the reason is due to market over react or everyone is looking for a reason to sell down the market, I manage to spot a trade sharing in my facebook page.
SGX - We can see that SGX has been trading side way channel after the price drop from $8. Thanks to Trump, I shared this trade in my facebook page today. Short @ $7.33 and set TP at $7.18 (By right is $7.2 but investing note doesn't allow). If the market doesn't recover after 1 or 2 days, can try for final TP @ $7.

You are remind to trade base on your own risk. Plan and Trade well :)

Sunday 5 May 2019

Market Update: 05 May 2019

Last Friday, US Nonfarm payroll easily beat Wall Street expectation with the actual figure of 263k increased by 196k in March of 2019. Unemployment rate fell to 3.6% vs 3.8% expected and the lowest since December 1969. US interest rates remain unchanged and investors had begun to expect that the Fed might signal a rate cut.

1) When Fed lowers Interest rate, lending becomes cheaper, increasing the flower of money. But inflation can become a problem.
2) When Fed raises interest rate, lending gets more expensive, this can slow down the economy. But it generally lowers inflation.

However, if Fed decides to lower the rate, the economy could be in danger of overheating, driving inflation. Cutting rates now would also take away weapons in Fed’s arsenal in the event of an economic downturn as the interest rates are only at 2.5% which doesn’t leave much room for rate cuts.

With the above information, does it really affect you will still depend on your trading time horizon. Going forward, I will be sharing simple trading strategies that a trader must include such as Time Horizon. Without further ado, we shall start with STI charting.

 STI continue to climb up to 3400 point which broke above the 61.8% Fibo from the previous support line. I take no position even though it has reached my red circle zone which I have shared in my last market update. I am monitoring closely waiting for a trade setup and trade signal to come into play. Remember that no position is still a position. (Most traders fail to aware that due to their hand itchiness and always wish to participate in the market)

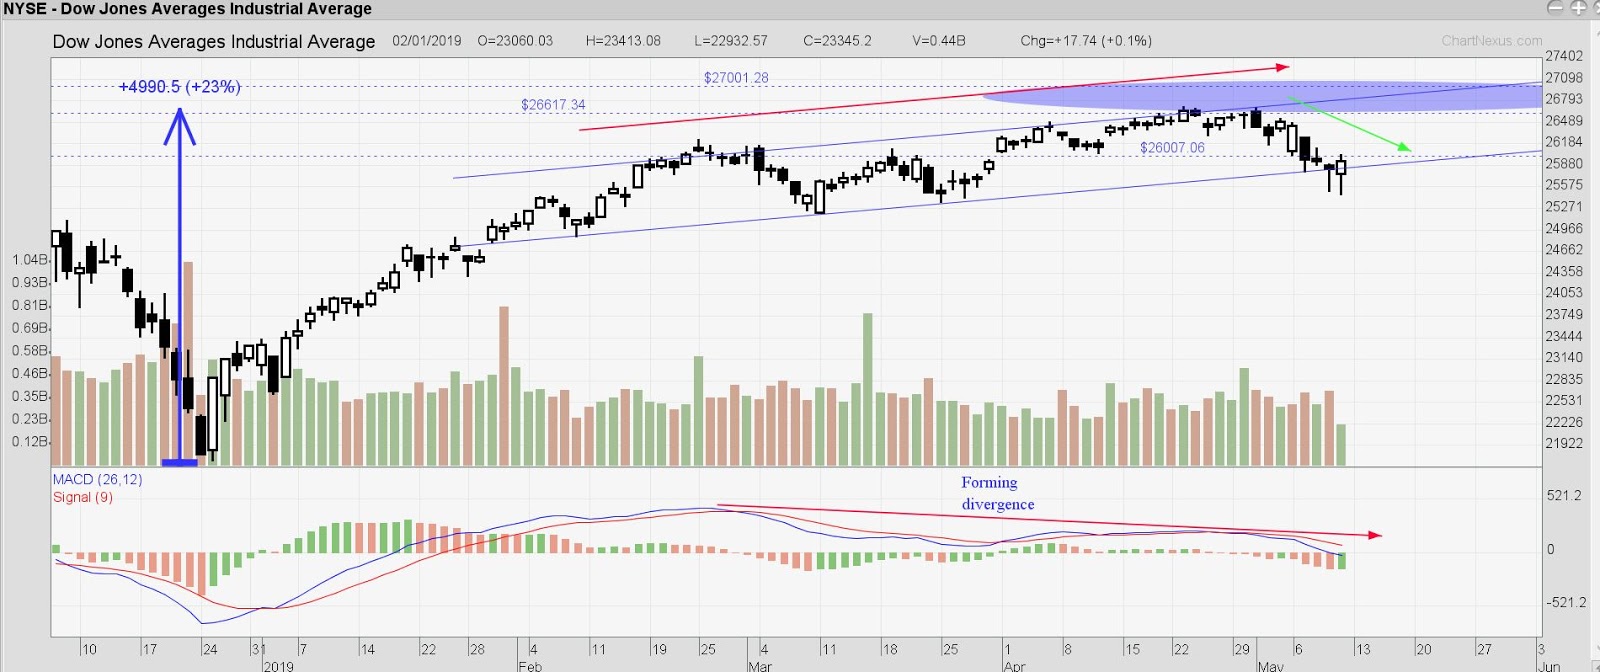
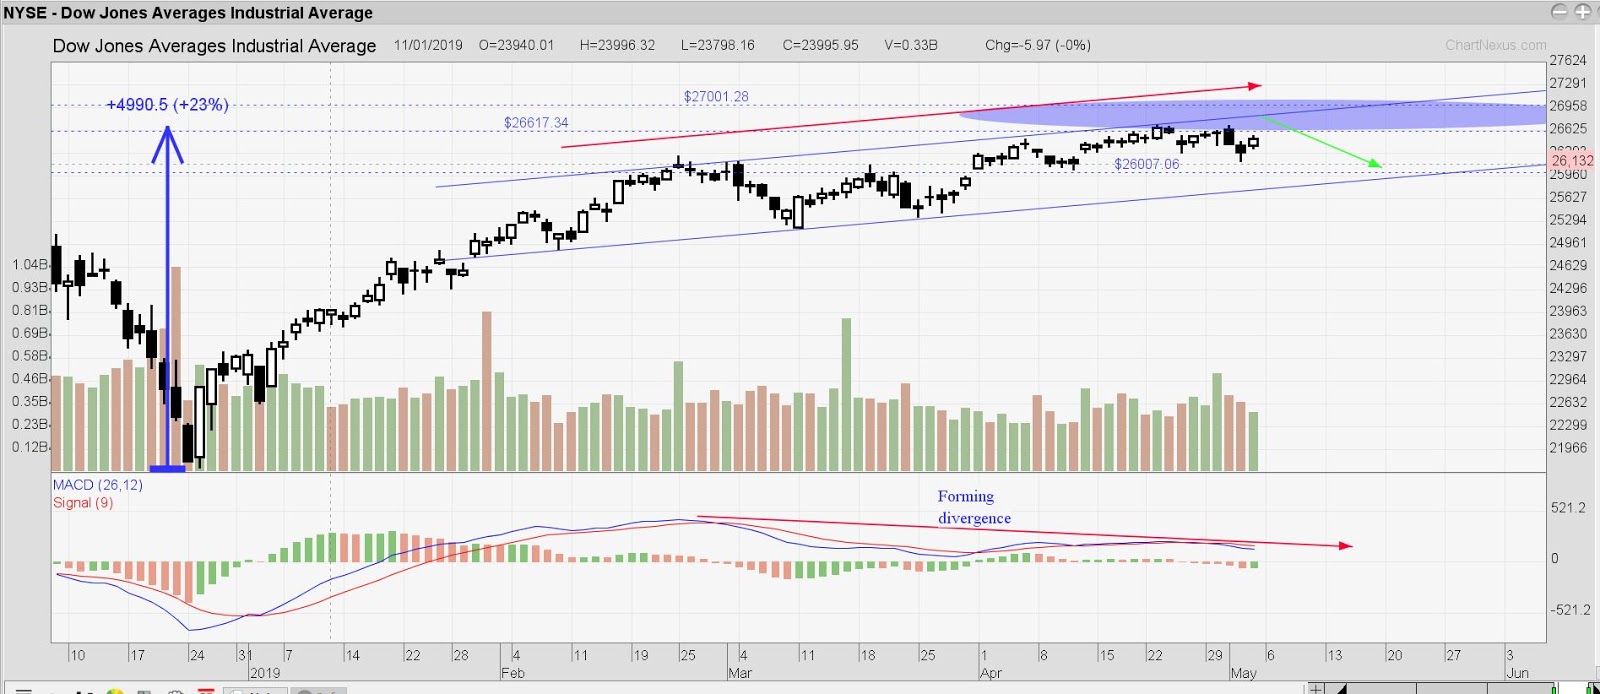
DJI – Even though last Friday US reported such a bullish data, but the market failed to break through the all time high. This might be because no one wishes to be trap entering at the high price. I will continue to monitor at 27k and wait for a reverse candle.

Oxley has sold Chevron House for up to $1.025 billion with terms in the contract. Base on the chart, the price closed above 200MA. If your hand is itchy to enter into the market, you may consider this trade. (I have no position in Oxley)
Entry: $0.305/$0.31
SL: $0.28
TP1: $0.34
TP2: $0.37

Overall: I will go with no position is still a position as for now unless those counters in my watch list show a better trade setup and trade signal with good reward to risk percentage.
Hint: Readers may take a look at CityDev (SGX: C09)

You are remind to trade base on your own risk. Plan and Trade well :)

Sunday 28 April 2019

(Returning Back) Market Update: 28 Apr 2019

Hi everyone, it has been close to 3 years since my last market update. Over the last 3 years, besides updating myself on the market and economy news, I have managed to pass CFA level 1 and attempted level 2 once before I paused it for my personal reason. Furthermore, after attended numerous of market events, different trading workshop and exploring on different trading strategies, I realized that all the above does not really improve on my trading accuracy but at least it does allow me to see the market from different perspective. I have been working in financial industry since 2014 (related to trading) and get to know that most of the victims in the market are our retail investors/traders due to limited knowledge. Even though I might not be a professional trainer or a successful trader, I believed the knowledge and experiences I gained over the years somehow sufficient enough to at least bring awareness to the retail (amateur) traders. Without further ado, I will start off with market update.


DJI – It has been a 23% uptrend since Dec 2018. The current price is at the top of the channel seemed like going to break above the all time high record. However, base on MACD, a bearish divergence is also forming. A decent pull back will be good for DJI. Therefore, I am monitoring for it to hit above 27000 (Whole figure) and keep a look out for reverse candle to short it down to 26000.

STI – It’s been uptrend since the start of year 2019. The current price is staying at the top of the channel conjunction with the 61.8% Fibo from the previous support line. (Highlighted in red circle) Most of the STI main component stocks going Ex-Dividend soon within this and next week. Once Ex-dividend plus the bearish divergence showing in DJI chart come true, I am looking for a pull-back for STI to hit around the 50% Fibo (3300). Overall: Since now is the earning reports season, watch out for your position size if you are doing any trades. We are entering the month of May whereby sell in May and go away may come in to hurt your profits. Learn to understand the beauty of no position is also a position. Going forward, besides sharing on market update and trades opportunity setup (Pre and post event), I will to input some basic trading guidance and hope that to provide a platform which consist of education purpose. I have setup a facebook page for the ease of sharing and posting any informative articles in future. If you are keen to join the community, click on the facebook link posted at the top right corner, follow and like my facebook page. You are remind to trade base on your own risk. Plan and Trade well :)